

XAU/G Back To 1999-2011 Levels?
Our research team continues to dig into underlying patterns and set up in the global markets to assist skilled technical traders in understanding the current Covid-19 virus event and other key technical data.
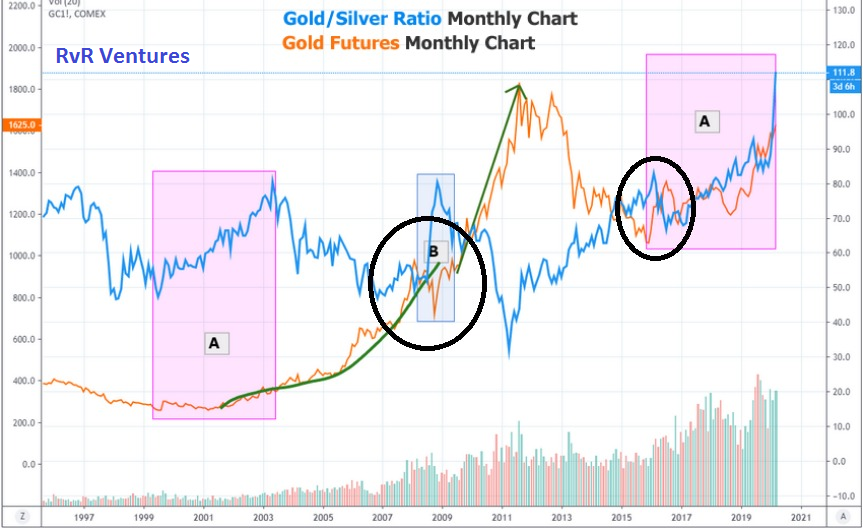
This first chart highlights the pattern we have identified and how we believe a similar pattern is setting up again in the current market. The setup of the pattern is explained in the text below, but quickly scroll down and look at the first chart and the pink shaded areas “A” to get an idea of what we are talking about.
PRIOR TO “A” PATTERN SETUP
- After a moderate price decline in Gold (1996 through 2001), a bottom sets up as the price of Gold begins to base near support.
- The Gold/Silver ratio (BLUE), falls throughout this pattern setup as both Gold and Silver prices decline somewhat in unison.
THE SETUP “A”
- Gold prices begin to rally moderately while pushing the Gold/Silver ratio higher over an extended period of time (from 1999 to 2003: about 4 years).
- The Gold/Silver ratio peaks and begins to decline in mid-2003 as the price of Gold continues to rally at a bit more accelerated rate.
- Gold prices begin a parabolic upside price advance in early 2006 after the Gold/Silver ratio collapses about 18% to 20% from the peak level near 82.50.
We believe a similar type of pattern is setting up right now in the metals market and we believe both Gold and Silver will engage in a price advance over the next 10+ months that may be similar to the post-A set up in mid-2003. If you are familiar with what happened in the metals market at that time, Silver began to advance at a faster rate than the price of Gold advanced. This is what caused the Gold/Silver ratio to begin to collapse.
Base: Past history, past trend, momentum shift, volume against price, price against demand, demand against price – all the co relation and balanced quotients are reversably proportionate and irreversably in the same direction following the last pattern, witnessed by the world.
XAGUSD | SILVER
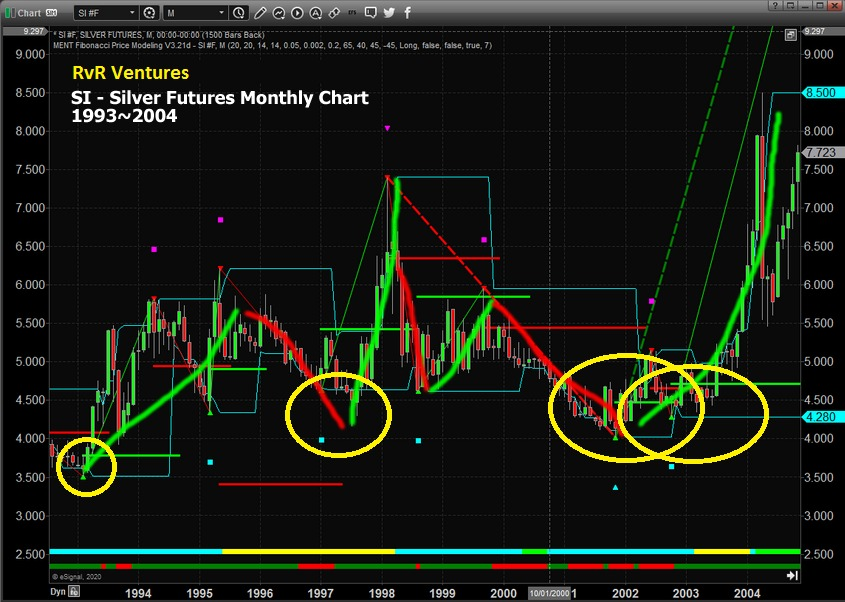
This Silver chart from 1993 to 2004 clearly shows how the price of Silver was reacting throughout the setup prior to “A” and after “A” in the chart (above). Silver began a moderate price advance in 1993 from a level near $3.50 and advanced to a level near $7.50 in 1998. Then, it began a downside price move to reach new lows in 2002. At that point, the markets changed. Gold and Silver began to advance almost in unison with Gold still advancing slightly more than Silver until early/mid-2003. Once Silver broke dramatically higher, in late 2003-04, the Gold/Silver ratio started breaking downward instead of upward. This is the pattern we are seeing in the metals market right now.
We believe the recent rotation in the metals market and the dramatic price divergence between Gold and Silver are setting up another similar type of pattern that could prompt both Silver and Gold to rally upward from current levels by at least 150-200%.
CURRENT SILVER MONTHLY CHART
The extremely deep price retracement on this Monthly Silver chart (below) highlights what we believe is a deep washout low price rotation that is setting up the “disconnect” as we have tried to explain in the Gold/Silver ratio chart and historical Silver chart (above). Yes, Gold also moved dramatically lower over the past 2+ weeks illustrating the shock to the markets that took place as the Covid-19 virus event disrupted the US and global markets. But our researchers believe this dramatic washout low in Silver is setting up a much bigger pattern, longer-term than most people understand.
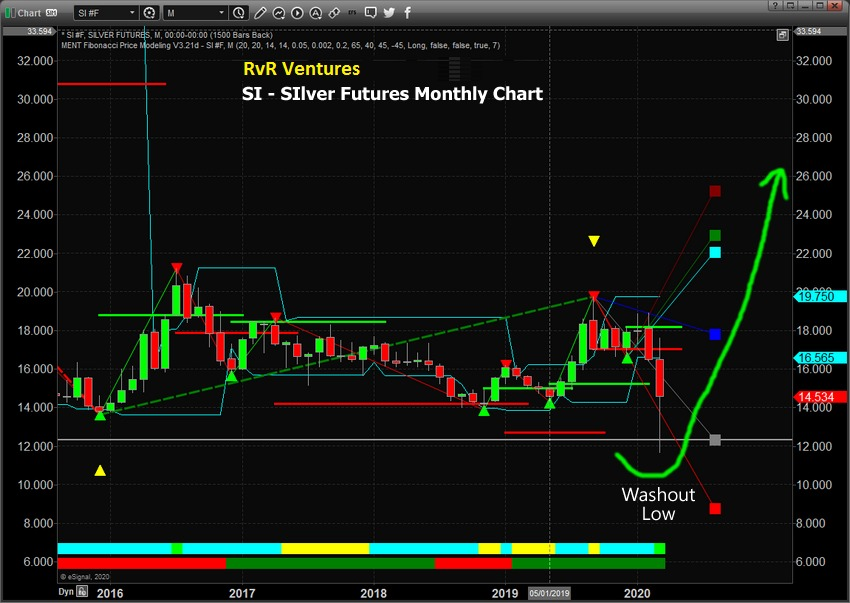
Recently, news that global precious metals suppliers have received a tremendous surge of orders for the physical stock over the past 2+ weeks (source: https://www.msn.com). In fact, many global suppliers and mints are simply “out of stock” at the moment. This surge in demand changes the dynamics of the market and how we look at the washout low in Silver.
If demand continues to surge, which we have no reason to doubt at this stage of the Covid-19 virus event, and Silver begins to rally as it did in 2002~2005, then the Gold/Silver ratio will begin to collapse just as it did in 2003~2007 (see the first chart – Post “A”). This means the demand for metals is skyrocketing and Silver has suddenly become a more “in demand” physical metal than Gold.
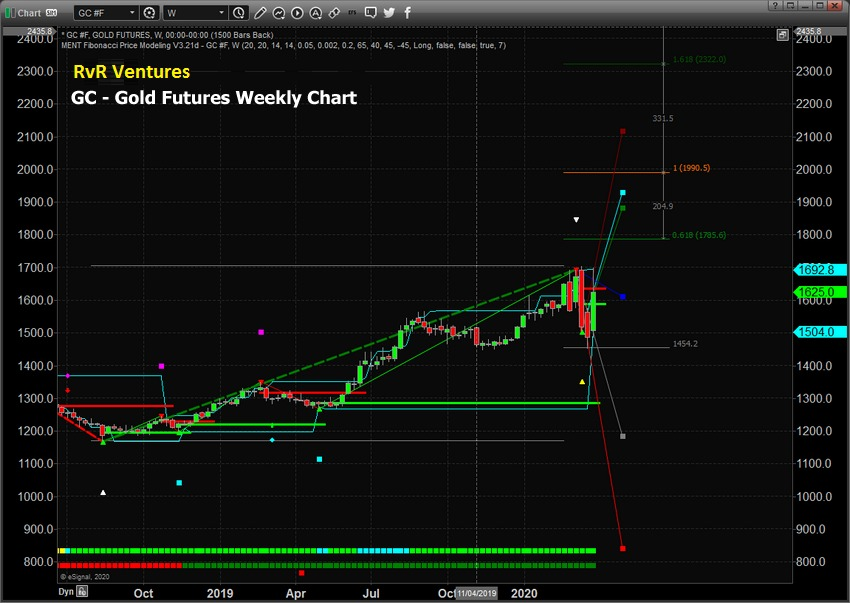
CURRENT GOLD WEEKLY CHART
We believe the next phase of price action in Gold is a move above $1990 as demand for metals continues to surge. This would represent a 100% Fibonacci price expansion of the last price rally from the lows set in September 2018 (near $1168). It would also represent a rally from the current level of at least +22.50% in Gold. Subsequently, if Silver begins to rally at a greater rate than Gold over this same span of time, Silver could rally to levels above $22 representing a +53% price rally according to our Adaptive Fibonacci Price Modeling system (the CYAN target on the chart below).
Pay attention to the Gold/Silver ratio and the price of Silver compared to Gold over the next 30 to 60/90+ days. If our research is correct, the current low price of Silver will be a distant memory in less than 60 days and a tandem price advance in both Gold and Silver will propel the metals much higher. How much higher? From 2003 to the peak in 2011, Gold rallied 450% (from $350 to over $1900). Over that same span of time, Silver rallied 1024% (from $4.50 to just under $50).
If we are right about this pattern setup and the future opportunities it may present, we could see Silver trading above $160 per ounce within 4 to 7 years. Can you guess where Gold would likely be trading if Silver rallied 1000% from current levels? Don’t miss this next big move in the metals. Gold Silver Price Analysis 2020-2022
Trade Responsibly | Risk Only As Much As You Can Lose | You Are Responsible The Profit & Losses on Your Trades | RvR Ventures holds no responsibility in any direct or indirect manner for the outcomes/profits/losses earned/lost by any party.