The Power of Golden Ratio!
Have you ever heard of The Golden Ratio? If you’ve studied mathematics or engineering you might have come across this in one of your modules. Although it sounds like a maths thing, the golden ratio appears everywhere, in geometry, art, architecture, nature and even the human body. And surprise, surprise, it appears in stocks trading too.
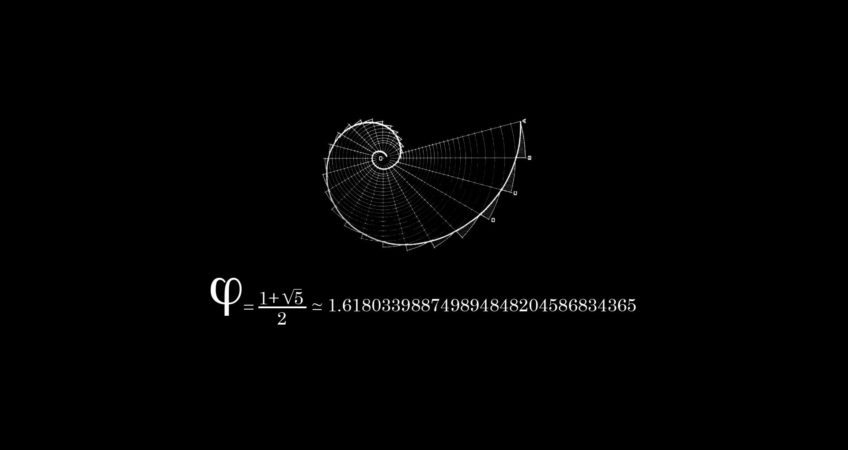
The Golden ratio is a special number found by dividing a line into two parts so that the longer part divided by the smaller part is also equal to the whole length divided by the longer part. It is often symbolized using phi, after the 21st letter of the Greek alphabet. In an equation form, it looks like this:
a/b = (a+b)/a = 1.6180339887498948420 …
As with pi (the ratio of the circumference of a circle to its diameter), the digits go on and on, theoretically into infinity. Phi is usually rounded off to 1.618. This number has been discovered and rediscovered many times, which is why it has so many names — the Golden mean, the Golden section, divine proportion, etc. Historically, the number can be seen in the architecture of many ancient creations, like the Great Pyramids and the Parthenon. In the Great Pyramid of Giza, the length of each side of the base is 756 feet with a height of 481 feet. The ratio of the base to the height is roughly 1.5717, which is close to the Golden ratio.
Let us illustrate it with a diagram:

If the length of a+b divided by the length of a is equal to the length of a divided by b, then the two quantities are said to be in golden ratio.
(a + b)/a = a/b = 1.6180339887….
It is often symbolized by the Greek alphabet phi, φ. Based on the writings of Mario Livio in his book “La historia de Phi, el número más sorprendente del mundo” (“The Story of Phi, the World’s Most Astonishing Number”) Phidias, the famous Greek Sculptor who designed the Parthenon in Athens, used the Golden Ratio in his works. In fact, Phi was named after him.
Over the years, many names have been given to it including extreme and mean ratio, Fibonacci’s numbers, medial section, divine proportion, divine section, golden proportion, golden cut and golden number.
As I mentioned earlier, the golden ratio appears every day in our lives, every time, everywhere.
Our Bodies: The ratio of the distance from the top of our head to our belly button to the distance of our belly button to the floor is in golden ratio.
Flowers: Take a closer look at a sunflower the next time you see one. It is said that these flowers grow in the Fibonacci Sequence number (I will explain this next). The reason is so that they get the maximum exposure to sun light.
Architecture: A lot of historical buildings were built using the golden ratio. The Parthenon and Great Mosque of Kairouan are some examples.
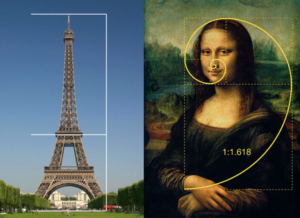
Paintings: The sacrament of the last supper by Salvador Dali, Mona Lisa and illustrations of polyhedral by Leonardo da Vinci were all said to exhibit the usage of the golden ratio.
As an investor or trader, you’ve probably heard of this indicator called the Fibonacci Retracement. Many trading strategies have been developed using Fibonacci but did you know the origins of the Fibonacci series is actually from the Golden Ratio?
In Mathematics, the Fibonacci numbers are,
0 , 1, 1, 2, 3, 5, 8, 13, 21, 34, 55, 89, 144, 233, 377
 each number is the sum of the previous 2 numbers. If you divide one number by the previous number, what do you get? 1.618, The Golden Ratio. But do remember if you use the numbers at the starting of the series, you answer is not very accurate, however, the higher up the series you go, the more accurate it gets.
If you are a Technical Analyst, Fibonacci is probably your good friend. Most of us use Fibonacci Retracements, Fibonacci Arcs and Fibonacci Fans. In all 3 applications, the golden ratio is expressed in 3 percentages, 38.2%, 50% and 61.8%.
Fibonacci retracements are areas on a chart that indicate areas of support and resistance. For Fibonacci Retracement, they are horizontal lines, for Fibonacci Arcs, they are curved lines and for Fibonacci Fans, they are diagonal lines. For simplicity, I will explain using Fibonacci Retracement.
Most trading platforms will allow you to plot Fibonacci Retracement lines, but many investors do not know how to use this tool. It is actually very simple. First, you identify if the trend is up or down. For example, the chart below shows that the price of DBS falling from S$21.50 to S$13.01. In order to draw the Fibonacci Retracement, you simply place your 0% line at S$13.01 and 100% line at S$21.50. To do that on our POEMS Platforms, select the Fibonacci Retracement Indicator, click once on S$13.01, drag your mouse to S$21.50 and click again.

We’re interested in 3 main levels, the 38.2% level, 50% level and 61.8% level. At S$13.01, traders start to use the 38.2% retracement level as the first resistance if the price were to reverse up. If it manages to break this level, the next resistance is at the 50% level and after that the final resistance at 61.8% level. Breaking all three level usually is an indication that the trend has reversed. Let’s see what happens after this.

After 6 months of trading, notice that the price of DBS reversed only to the 38.2% level and then reversed back down. In fact, it happened almost 5 times in the 6 months period. An average trader would only now realize that this is a resistance level, but if you had used Fibonacci retracement, you knew it 6 months before him. Let’s move on to test the theory further.

Going forward another 4 months, the price of DBS finally breaks the 38.2% level and at once break the 50% level to the 61.8% level before reversing down again. In classic support and resistance, once the price breaks a resistance level, that level becomes a support, hence, in this case, the 50% level becomes a support level. And very nicely, the price retraces back to the support level and bounces up again.

And once the 61.8% level has been broken, the trend has reversed! This is when technicians will re-evaluate their trading strategy and plot a new set of Fibonacci lines.
For more Trading Strategy & Facts, email us your queries at info@rvr.ventures | Chat: +971-581958582
